Lap Raptor Blog
Lap Raptor Update: February 2023
Many improvements were made to Lap Raptor in February 2023. We now have loop data, splits on track type, and more.
Posted: March 1, 2023, 6:23 p.m.
On the relationship between starting and finishing position in NASCAR
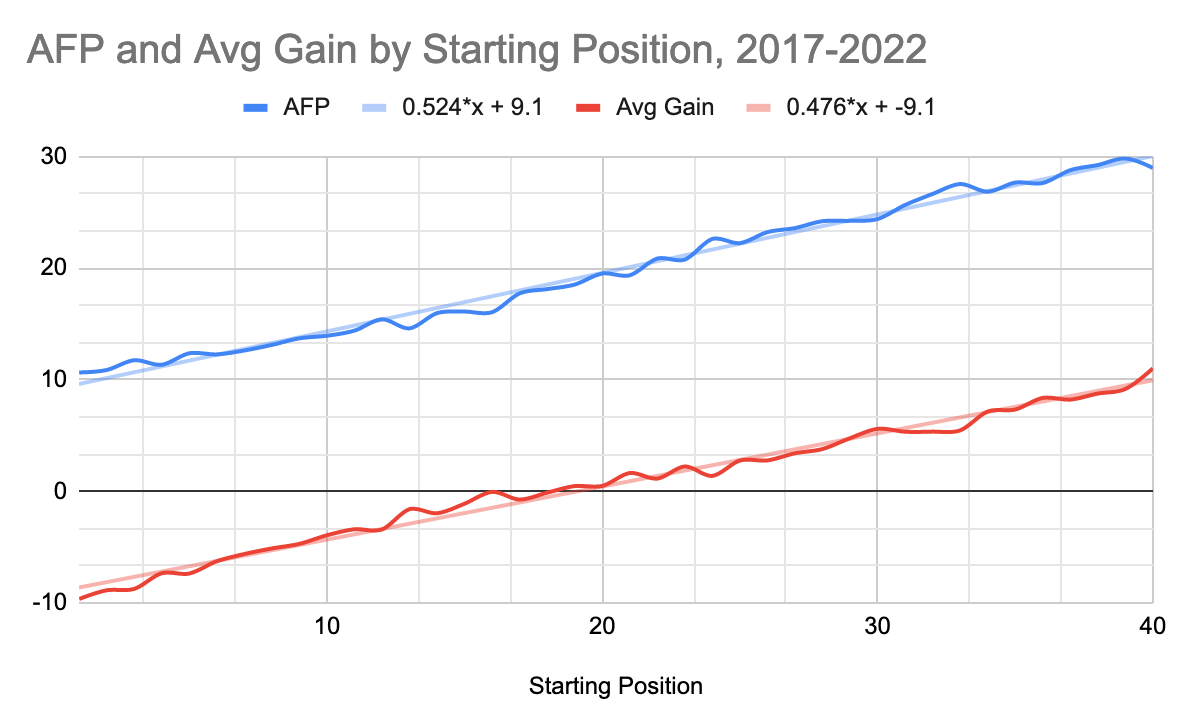
The chart above shows that a gain of one starting position, be it by lineup formula or qualifying, results in a half position gain in average finish. This is an aggregate across the last six years of NASCAR’s three national touring series (Cup, Xfinity, and Trucks, for the recreational reader). Such a relationship is to be expected: if you qualify well, you’re likely set up well for the track. It makes even more sense when you consider that, on average, the best teams are qualifying highest: of course they finish better.
The intercept - where the line starts on the left side - is where things get interesting. Starting a race on the pole still results in an average finish just outside the top ten. It’s higher still when you isolate for just the Cup series. It’s for this reason that teams should not practice for qualifying or set their cars up for qualifying. If you have a chance to choose between working on race speed or qualifying, almost all resources should be put into race speed - especially late race speed.
There’s reason to believe teams like Penske / Wood Brothers, and the 8 at Richard Childress Racing have not been heeding this, based on their ΔPOMS. Is it any surprise that their drivers, particularly Ryan Blaney, Matt DiBeneddeto, and Tyler Reddick have been so hard fought for wins?
Posted: Oct. 31, 2022, 9:43 p.m.
Martinsville falloff through the years
There’s been quite a bit of discussion about the universally panned, utterly uneventful 2022 spring Martinsville Cup race, particularly about the tires. Check out the below links to the lap time graphs of the POMS leaders from the last three years’ spring Martinsville races:
- 2022 William Byron: starts at 94 mph, down to 93 after 30 laps, 91 after 50, 90 after ~100
- 2021 Denny Hamlin: 93 to 88 after 30 and holds
- 2020 Joey Logano (caveat - this race happened in June because of the pandemic): similar to Hamlin; 93 to 88 after 30 and holds
The differences in absolute numbers are minute, but the shapes of the charts tell a pretty clear story of rapid tire falloff in previous years and linear falloff in this year’s race.
I don’t see the same differences in other flat-ish short tracks. You can check for yourself:
Was it the NextGen car? Reduced horse power? New tires? Cold temperatures? It’s not clear, but there’s something going on.
Posted: April 10, 2022, 10:55 p.m.
Has Hendrick improved?
Replacing one of worst competitive regulars with the best is the reason the organization looks so dramatically improved. Replacing a deep negative with a glowing positive has affected the net results far more than any gains they could have made to the program that won them the championship in 2020. They’re set to repeat in 2021.
Posted: Sept. 27, 2021, 5:23 p.m.
New features: better driver pages, finish stats
We’ve substantially improved our driver profile pages, added more result based stats to all aggregate reports, and added OEM logos everywhere possible.
Posted: June 1, 2021, 9:13 p.m.
New features: preferred reports, glossary, car overviews
Lap Raptor has added some new features. I find them useful! They include new account features, a glossary of terms, and car overview pages.
Posted: April 11, 2021, 10:27 p.m.
3/14/2021 NASCAR Cup and Xfinity Series Phoenix Preview
This is a new series in analyzing data pertinent to a race weekend to predict who will be successful among the three national NASCAR series. We’ll use speed score, retention ratings, splits, and other tools available at rrel.ca. It remains to be seen if said metrics can predict winners, but anecdotally they’ve been good at predicting success. This weekend brings the Cup and Xfinity Series to Phoenix Raceway for the spring Phoenix race.
The picks: Joey Logano, Chase Elliott, Justin Allgaier
Posted: March 12, 2021, 9:39 p.m.
Feature update: retention tweaks, and a note on average running position
First update: the maximum denominator of the retention score weights is now 20 instead of 10 to better represent the realities of the sport. The top twenty cars are competing for playoff spots. 10 and 20 are equally arbitrary, but 20 has that backing it. The original post has been updated and contains much more information.
Second: One of the flaws of the weighted retention scores was that it didn’t give any credit for running up top. If there’s a constant battle between second and third, they can rack up a lot of points. Meanwhile the guy in first gets nothing. The new “Position Unchanged” rating assigns 1/(current position +1) points for each lap where a driver’s position is unchanged (cautions excluded as always). Net Retention is thus gain rating + unchanged rating - loss rating, and Retention Ratio is (gain + unchanged) / loss.
Posted: March 9, 2021, 7:57 p.m.
Rrel Explained: Retention, gain and loss ratings
Racing Relativity offers two types of retention report: cumulative and per 100 laps. Let’s address the columns in chunks, discuss what each stat is useful for and how we can develop a better retention metric that may have predicted the 2020 Champion.
Posted: March 8, 2021, 10:31 p.m.
New feature: driver race pages
A quick note on a new feature:
We’ve added pages for driver pages at individual races. You can access these from driver pages and race pages. This links to Chase Elliott’s championship win. The page has a graph of all that driver’s lap times and a list of their laps with runni
Posted: March 8, 2021, 8:47 p.m.
Rrel Explained: Speed Score
It’s difficult to devise catch all metrics for composite processes. The goal in autoracing is to win races, and the simplest way to do so is to drive faster than everyone else - but driving faster means a lot of things. You can give it 100% all day, but you’ll find yourself wearing through your equipment. You can run safely and consistently, but can you run quickly at opportune moments? How do you measure what it means to drive fast in a 500 mile race? Is it who has the fastest peak, and thus records the fastest lap? Is it who is most consistently fast and records a strong average speed? Or is it somewhere in the middle? That’s what speed score is looking to solve.
Posted: March 7, 2021, 9:50 p.m.